Bitcoin price decline is second longest in history
There are only 20 days left before bitcoin hits the longest correction in its history, says J.A., an analyst at CryptoQuant. Martin.
Highlights:
- During the 2013 correction, the price of BTC took 411 days to bottom out.
- The current correction lasted 392 days.
In a comparison of bitcoin price corrections, CryptoQuant J. A. Maartun said that the current bitcoin (BTC) price correction is the second longest in its history after the one recorded in 2013.

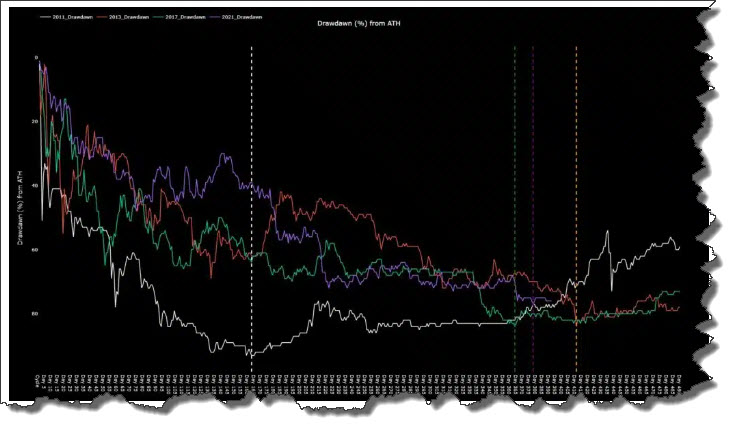
“Bitcoin is heading towards the longest bear market in its history (or we have already hit bottom),” Maartun noted in a tweet. The chart below shows the price trajectories from the respective highs of 2011 (white), 2013 (red), 2017 (green) and 2021 (purple) respectively.
The price scale is measured in percentages, and it can be seen that the size of the 2011 correction is the largest of the four considered, as it exceeds 90%. In the analysis carried out by CriptoNoticias at the end of November 2021 on the main corrections of bitcoin, the one that took place in 2011 showed a price drop of 93%.
This correction is also the one with the shortest duration. Its duration is 159 days, or just over five months. However, the longest bitcoin price correction was the one that started at the end of 2013. In this, the price of BTC took 411 days to reach its lowest level, almost a year and four months.
Maartun suggests that bitcoin’s low could be the yearly low reached last November, but notes that a total of 392 days have passed since the November 2021 high. cannot yet be precisely determined. .
Based on this data, it is concluded that if bitcoin maintains the current price level, it will take 20 days to surpass the duration of the longest correction in its history. In terms of the magnitude of the correction, the price of bitcoin, which stands at $16,722 at the time of writing, is down 75% from its peak in November 2021.


